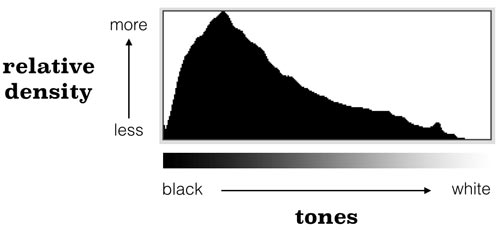
The histogram is one of the most under-utilised photographic tools. It shows the relative distribution of tonal values in the image from black on the left to white on the right. Consequently, a darker image will have a histogram skewed to the left whilst a lighter image will have one skewed to the right.
To be clear, standard histogram like the one above is not concerned with colour distribution—only the tonal value (typically measured between 0, black, and 255, white) of each pixel. To create the histogram you first go through every pixel in the image and note down its tonal value, then count all the pixels with a tonal value of 0, then those with a tonal value of 1, … and finally those with a tonal value of 256. Put that data into a histogram (or bar-chart) and you’re done!
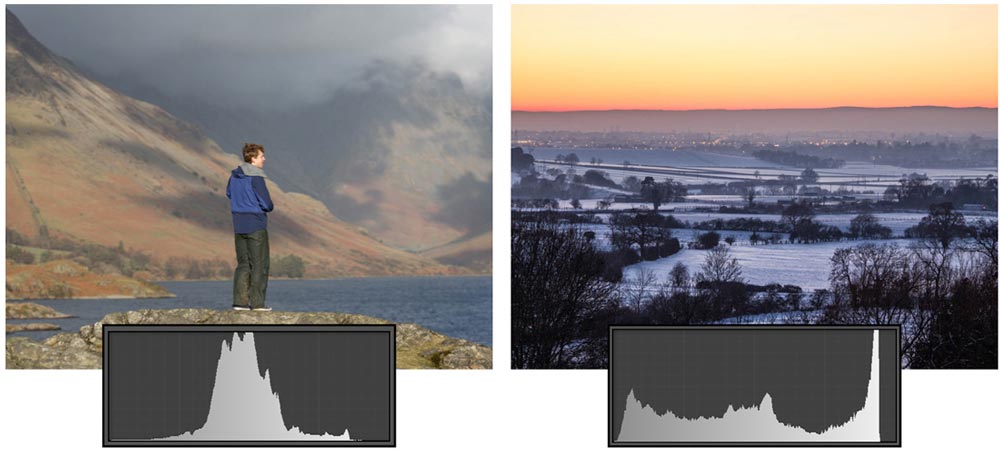
There is no such thing as a “correct” histogram. The two images below are both correctly exposed but have very different histograms.
The colour blue below also has a histogram. There can be no debate here about whether the histogram is ‘correct’ or ‘good’; the single line in the middle simply reflects the fact that in RGB scale the colour is (19, 107, 251).

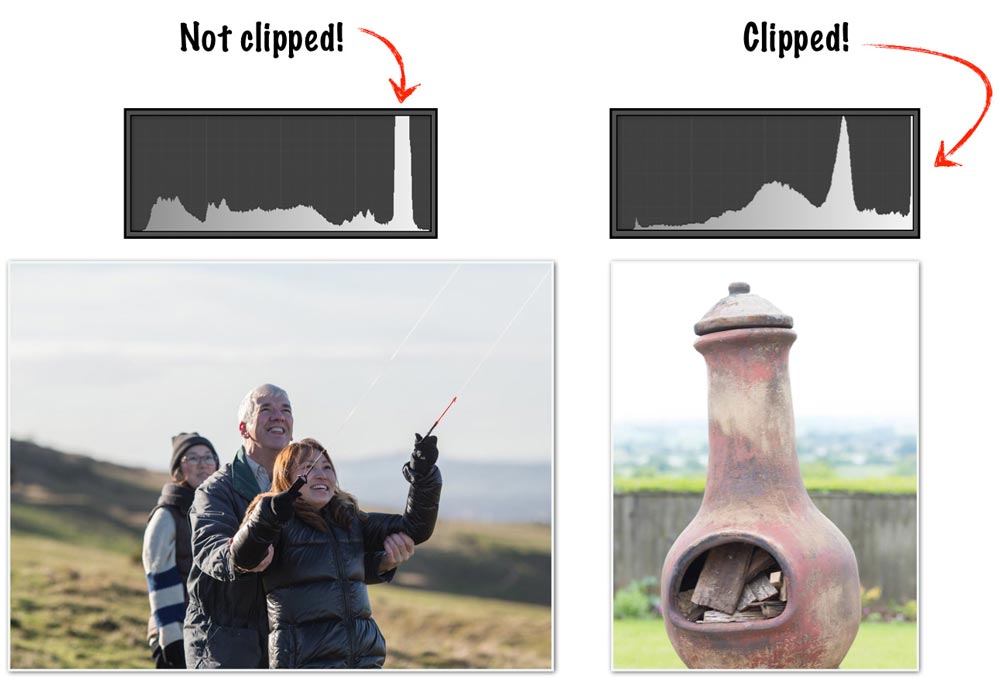
Because we are referring to areas in the image which have moved to pure black or pure white, clipping can be spotted by looking at the edges of the histogram. Often you will see a short spike at either side (or perhaps both) of the histogram—the high of the spike indicating the relative density of the pixels and thus how much clipping has occurred.
Below, only the right-hand image shows clipping (sky is pure white and has lost all detail) which is reflected in sharp line hugging up against the right edge of the histogram. Note that in the left-hand image’s histogram the graph shooting through the top does not illustrate clipping. The y-axis on the histogram shows relative density and because of the greyish hue in the sky perhaps 40% of the total pixels in the image fall have a tonal value in the 225-245 range. The computer could just as easily create a histogram that doesn’t let this banding shoot through the top of the box but then the other areas (e.g. the small jump to the left-hand side—probably the black jacket of the girl flying the kite) would have to be made smaller to keep everything in proportion — and this would make the histogram more difficult to read!
Simply by looking at the image on your camera display these clipped areas may go undetected, the moment of realisation perhaps coming later when you’re back at home at your computer and unable to correct exposure or change position to get a more balanced shot.
Essentially, the histogram should be used to reveal what the eye cannot see—even a quick glance after each shot might save a few disappointed moments later on.
The Longer Story
That’s the basic idea. In reality, the story becomes a little more complicated if you want to understand histograms in more detail. First of all, histogram data is gamma-encoded. Secondly, there is more than one type of histogram.
Histograms are gamma-encoded
There isn’t really any such thing as a RAW histogram. To produce an image the camera (or post-editing software) must go through the entire de-mosaicing process to turn the millions of red, green, blue pixels into something comprehensible. If you’re shooting in RAW then the histogram on the back LCD of the camera is actually a histogram created from a JPEG of the RAW file—and all JPEGs (and other digital image files, for that matter) are gamma-encoded, the reasons for which are detailed in another article.
The aim of the histogram is to show a distribution of tonal values to which we can relate. As covered in the metering article, the relationship in human vision between luminosity and brightness (perceived luminosity) is non-linear—it can be approximated accurately by luminosity0.42. Gamma correction uses an exponent of 0.45—very similar. Consequently, by using gamma-encoded data to form the histogram the camera or post-editing software can display the tonal values as we would recognise them. To be clear, other adjustments could be made to the tonal curve that would change the histogram and the main point is not to encode for gamma but to correlate the output to our our visual response. If it did not do this and took the data directly from the gamma-corrected (decoded) image then the histogram data would likely be clumped up towards the left end of the graph.
RGB, luminosity, and colour histograms
For the blue colour at the top of this article we never actually stated how the computer (or in-camera LCD histogram) arrived at one tonal value for a colour that has three components (19, 107, 251).
There are two main types of histogram in digital photography. An RGB histogram is the most simplistic as it simply combines each of the RGB values to produce the final histogram. A luminosity histogram is a slightly more complex beast. Whereas the RGB histogram simply clumps the three colours channels together, the luminosity histogram recognises the fact that the human eye does not respond to each colour equally.
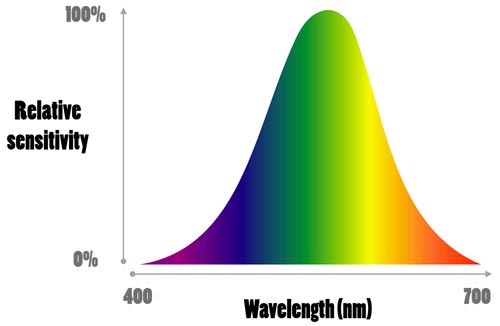
As can be seen from the graph above, the human eye is far more sensitive to green light than it is red or blue. This is the reason why CCD and CMOS sensors have double the number of green pixels than they do red or blue. The luminosity of a given point in digital photography is calculated as:
Luminosity = 0.299(R) x 0.587(G) x 0.114(B)
So, for instance, the luminosity of the blue colour above would be:
Luminosity = (0.299)(19) x (0.587)(107) x (0.114)(251) = 97
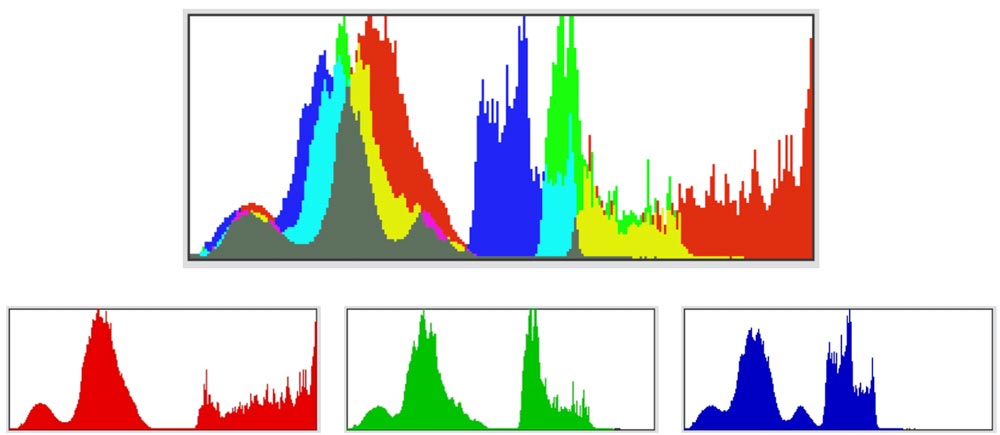
As a result of this weighting the shape of the histogram will also change. Take a look at the photo below.

Below are the individual histograms for the red, green, and blue channels. These should make it clear how the RGB transforms into the luminosity histogram. The green and blue channels (combined 89% weighting) are very similar in shape and whilst the red channel shows lighter tones towards the right it only has a weighting of 11% so these aren’t seen in the final luminosity histogram. The other point here is that by viewing the luminosity histogram alone you wouldn’t be able to spot the clipping in the red channel. This is why many advise that looking at the combined colour histogram immediately below is more revealing than either the RGB or luminosity histograms.
